Load-Forecasting Challenge 2026: six weeks, eleven teams, one forecast every day
2026-07-20
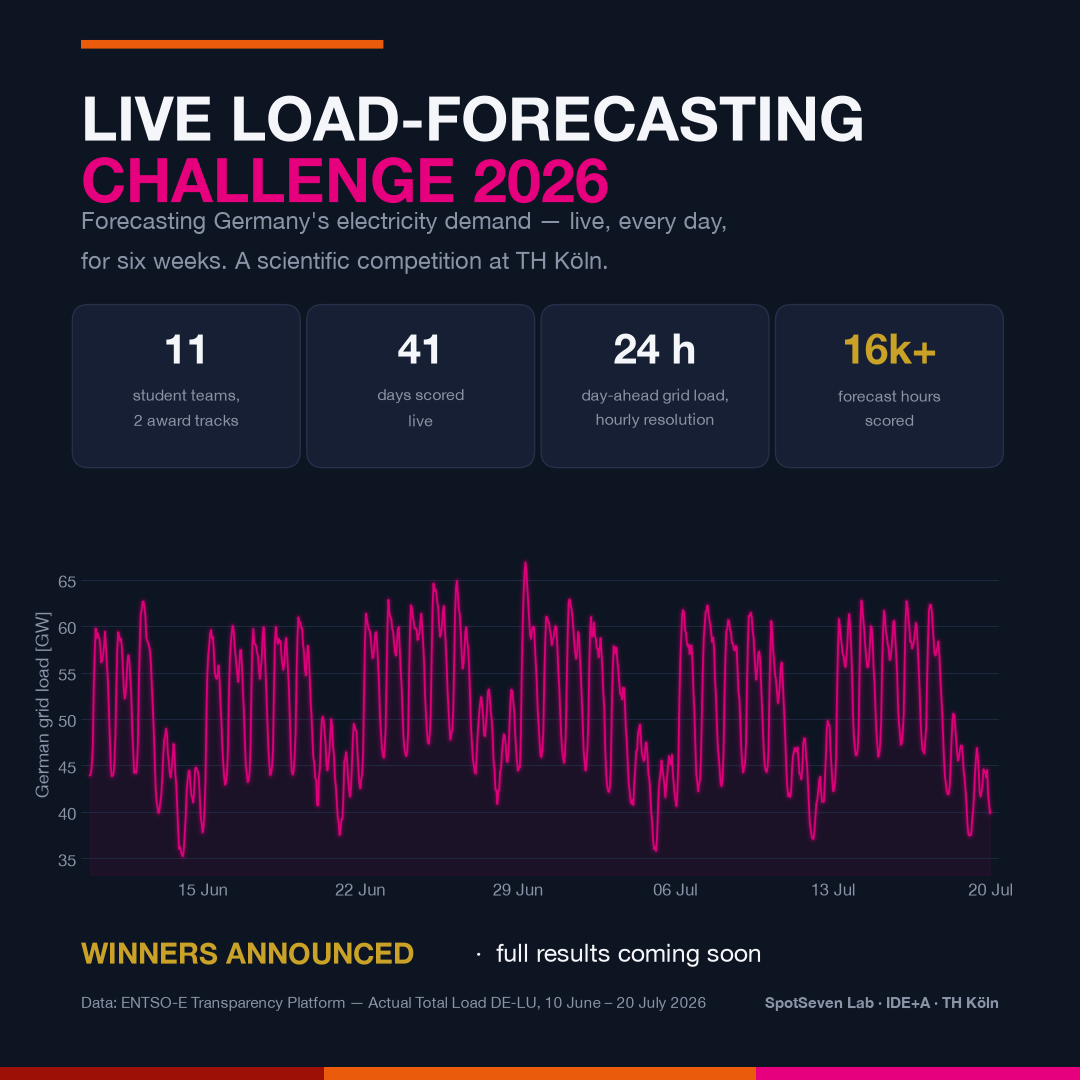
The Live Load-Forecasting Challenge 2026 at TH Köln has crossed the finish line. Since June, eleven student teams submitted a fresh 24-hour forecast of Germany’s national electricity demand every day before midnight. Scoring was automatic the next day, measured against the actual grid load published by the ENTSO-E Transparency Platform. No toy dataset, no second chances: a live, fully reproducible forecasting competition under real-world conditions.
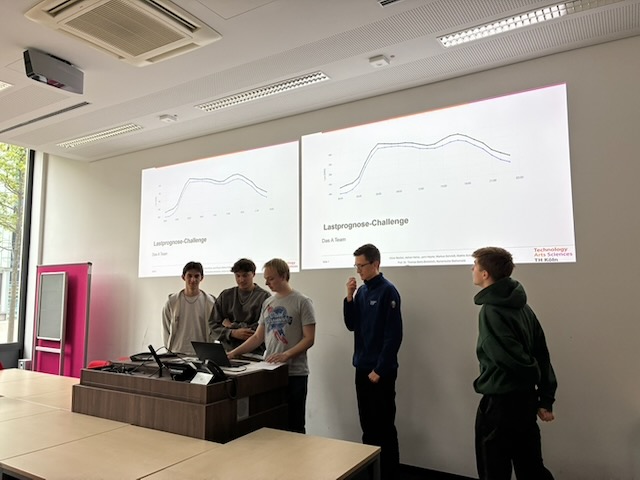
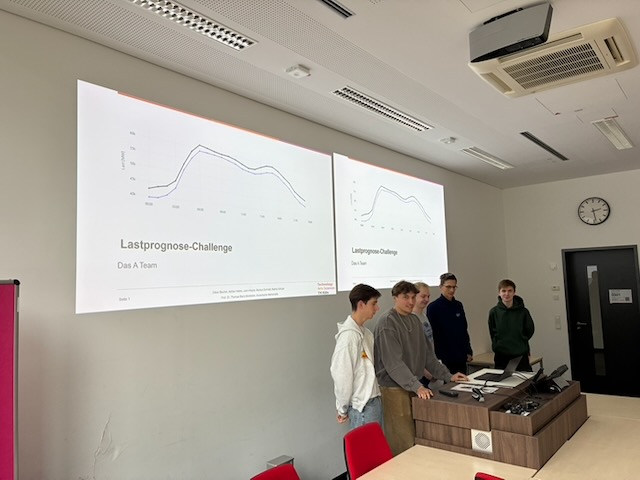
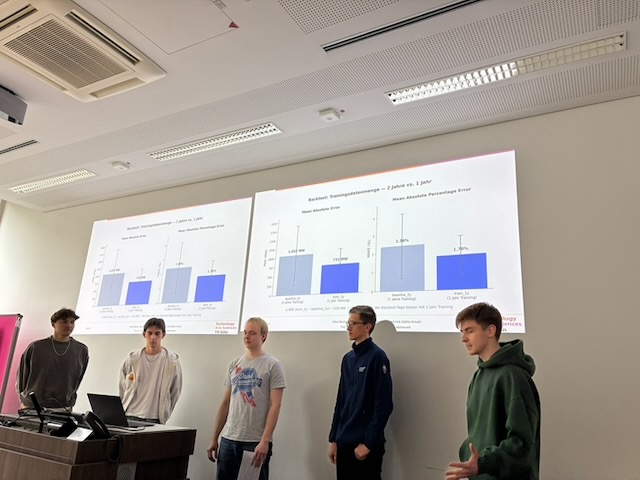
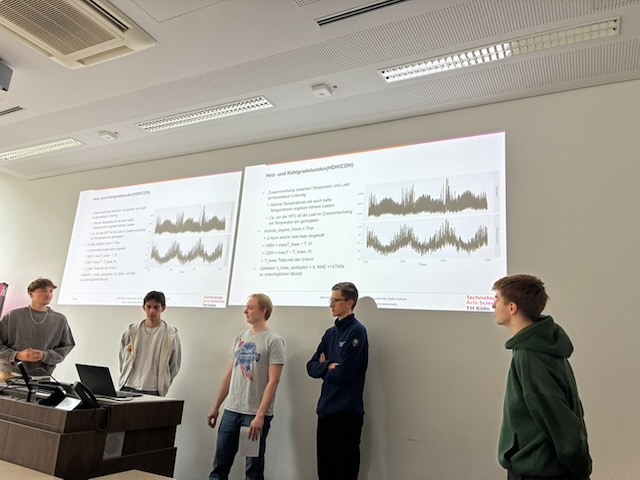
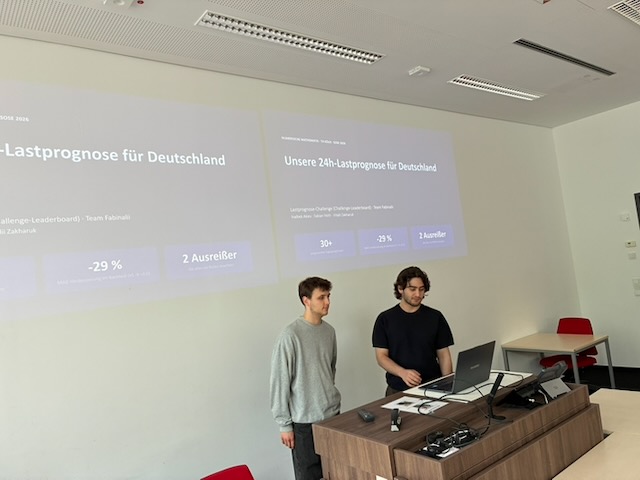
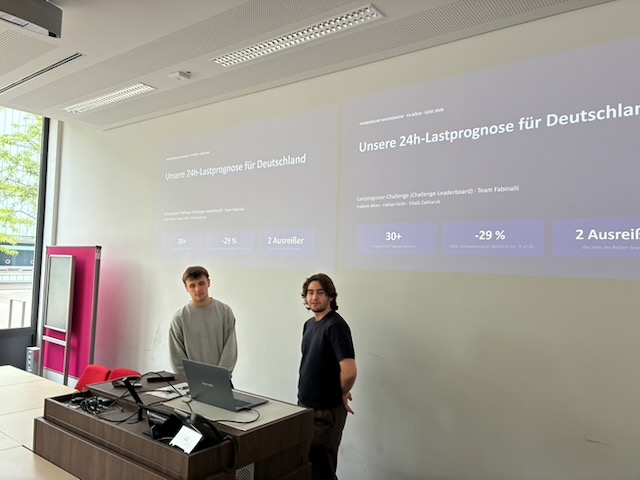
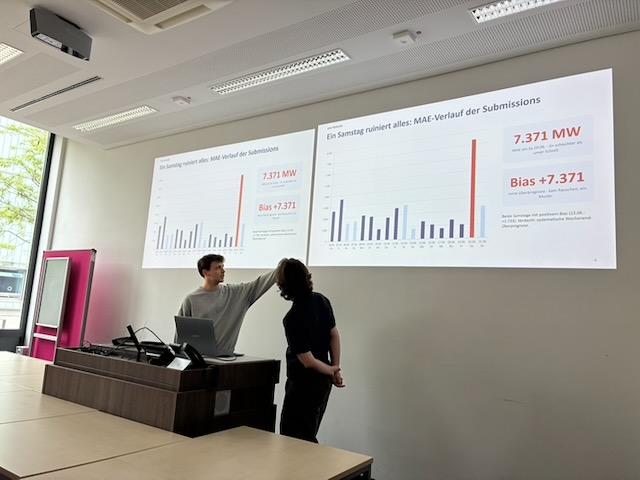
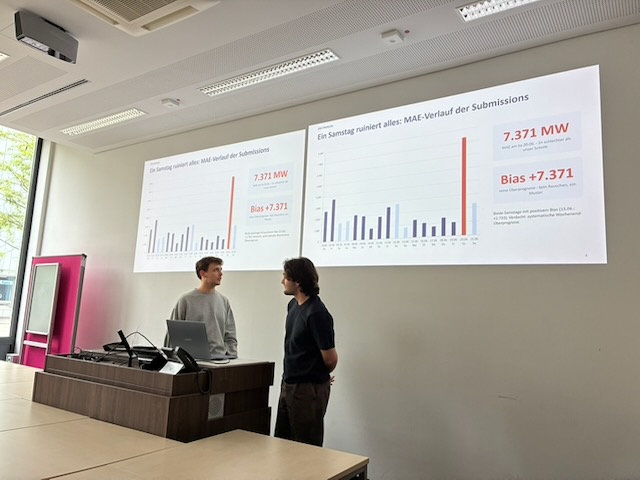
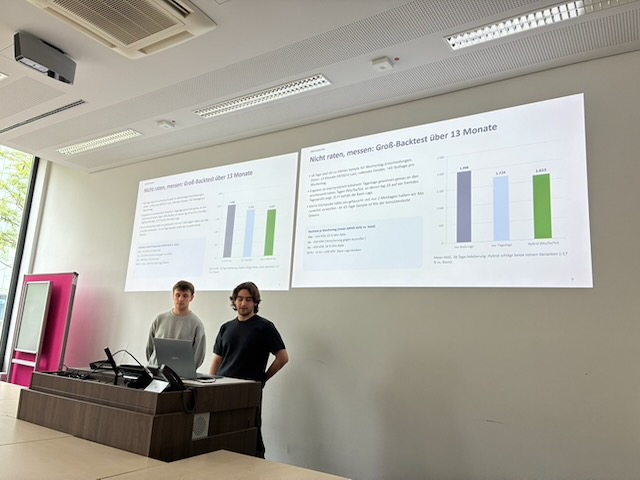
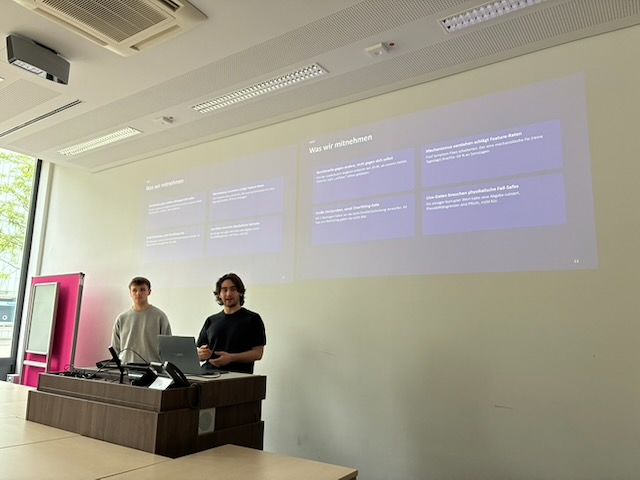
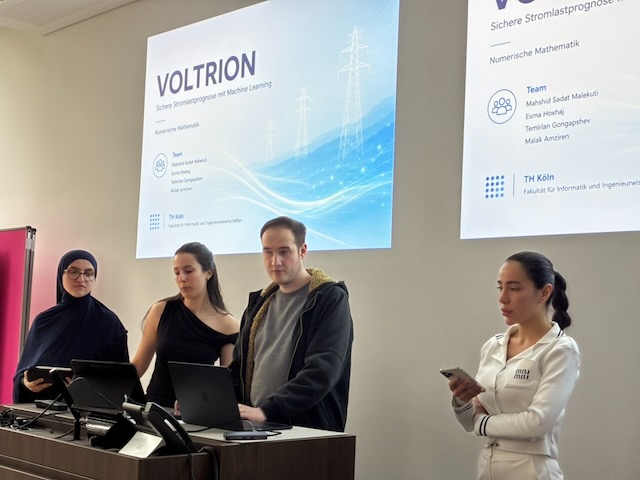
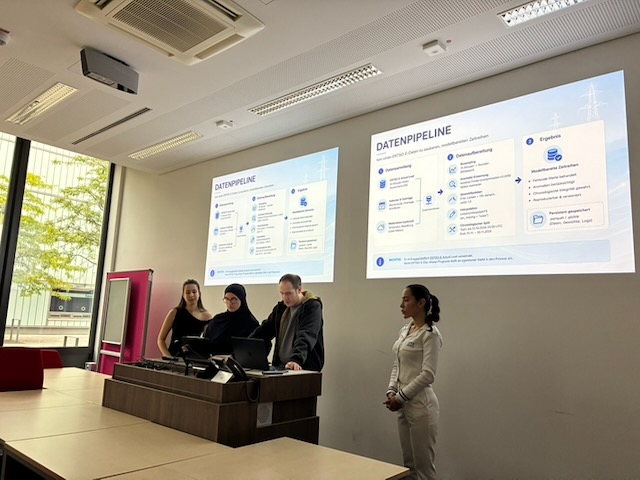
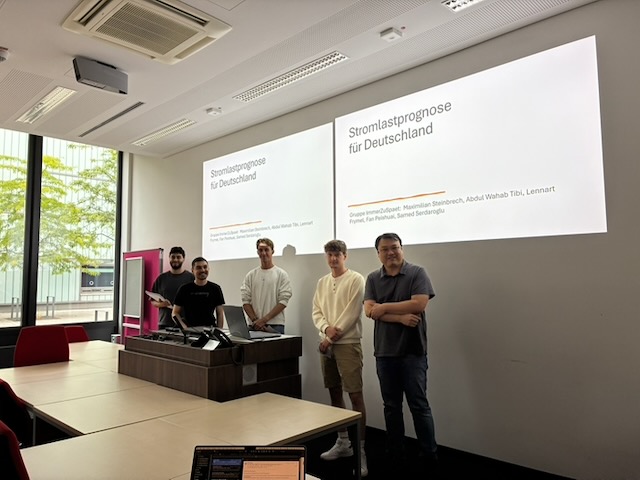
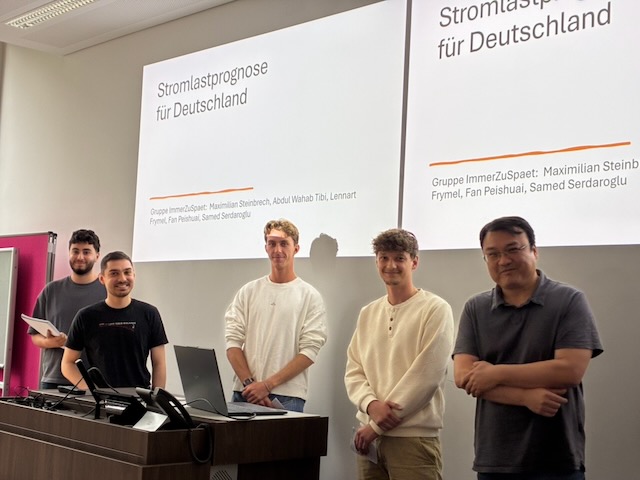
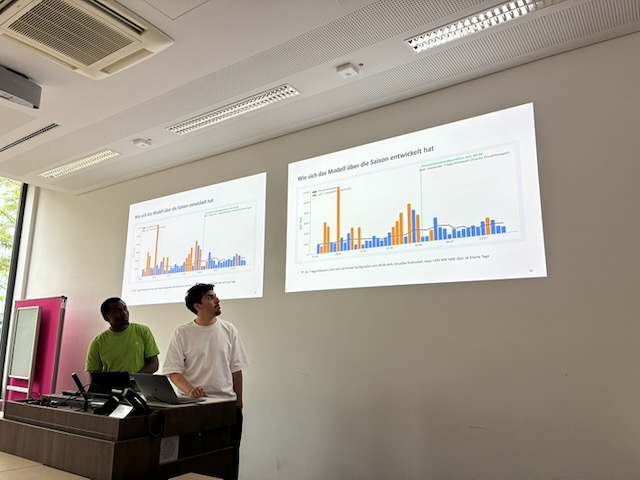
The challenge was part of the module “Numerische Mathematik” (Numerical Mathematics, summer semester 2026) taught by Prof. Dr. Thomas Bartz-Beielstein at the Faculty of Computer Science and Engineering Science of TH Köln. In the final presentations, the teams presented their approaches, from carefully engineered gradient boosting to modern time-series foundation models. The winning teams of the two award tracks will be honored soon.
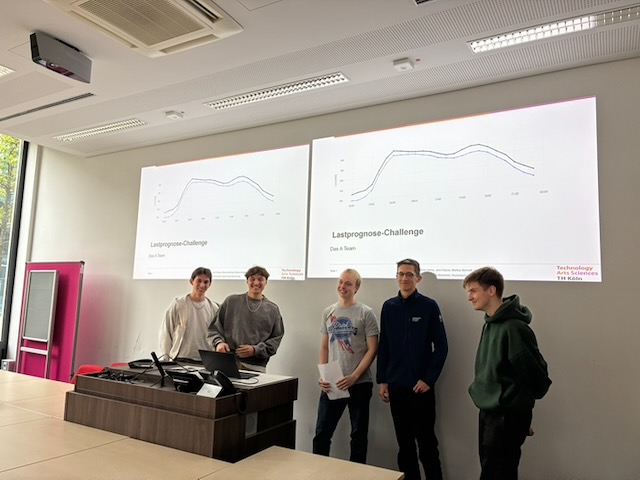
The challenge also doubled as a lesson in open, verifiable research: the teams published model cards, ran OpenSSF security scorecards on their repositories, and cross-certified each other’s results through independent reproduction.
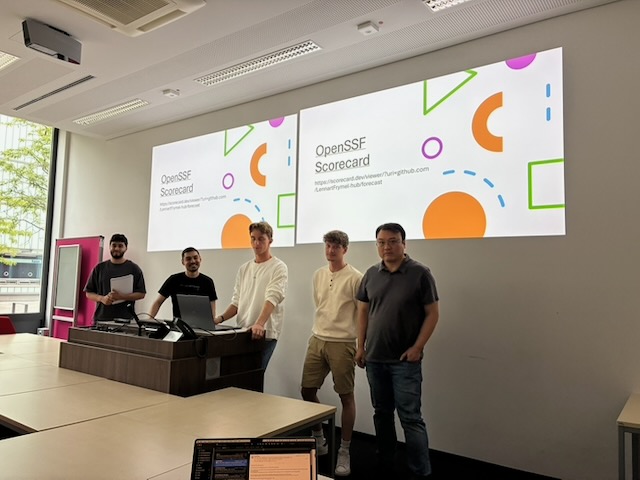
The challenge also yielded valuable insights into forecasting energy demand in Germany: how much calendar structure — public holidays, bridge days, day types — and weather covariates really contribute, and how carefully engineered gradient boosting holds its own against modern foundation models. More details, including the full methodology and results, will be published soon.
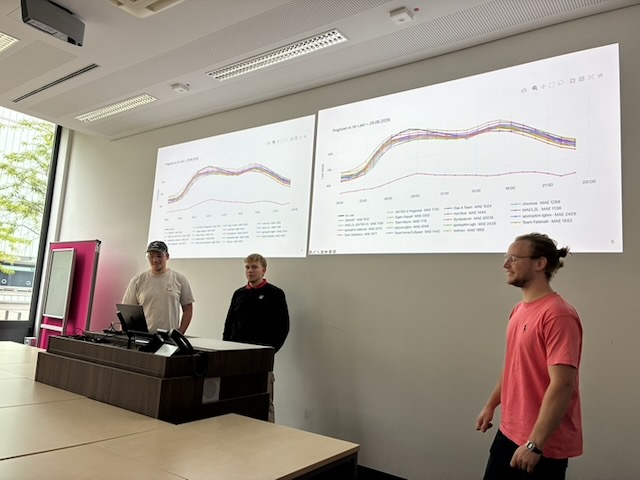
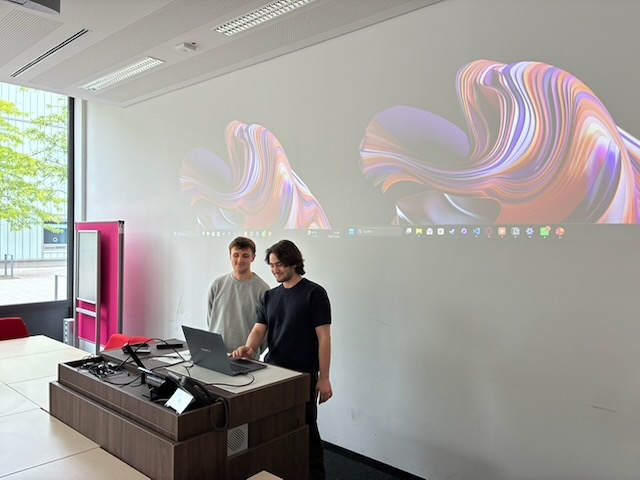
Impressions from the final presentations
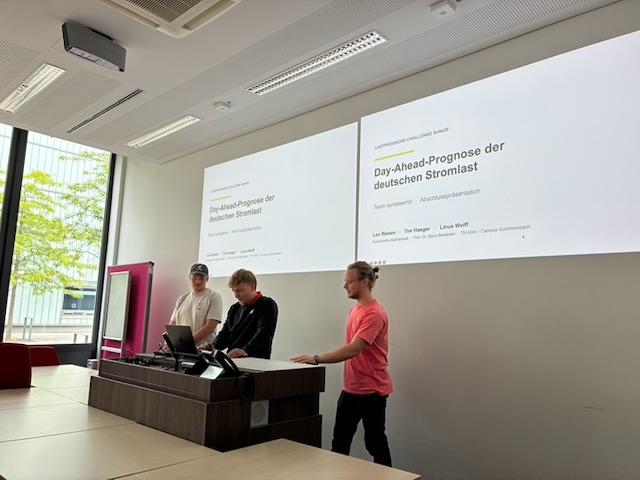
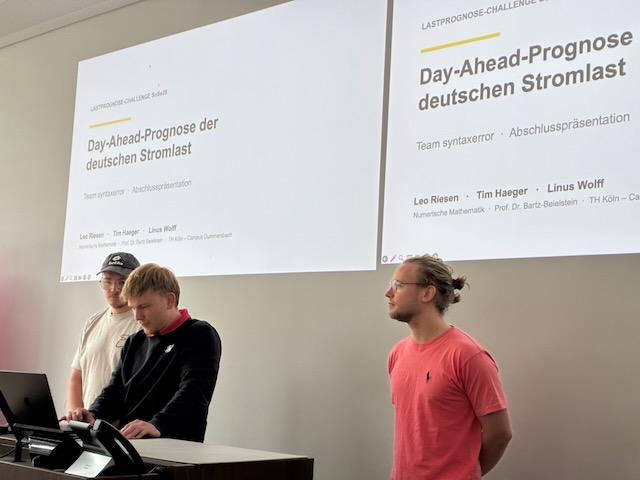
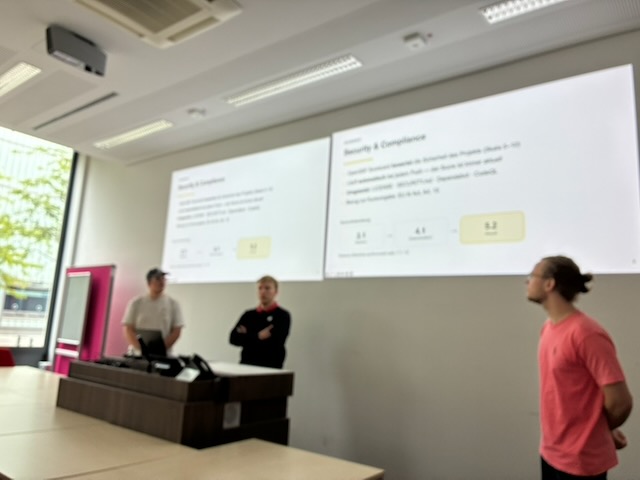
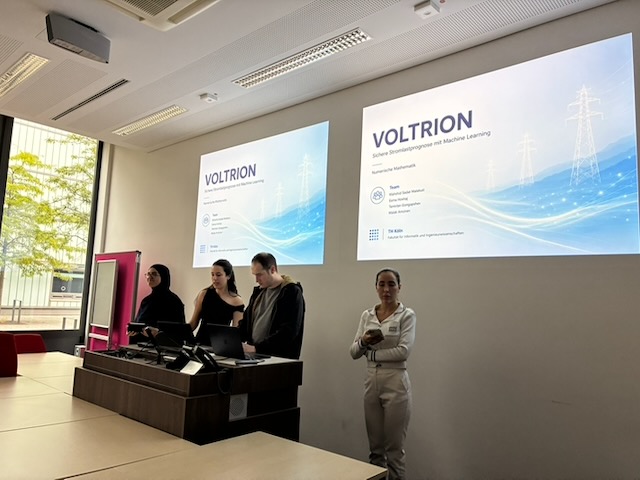
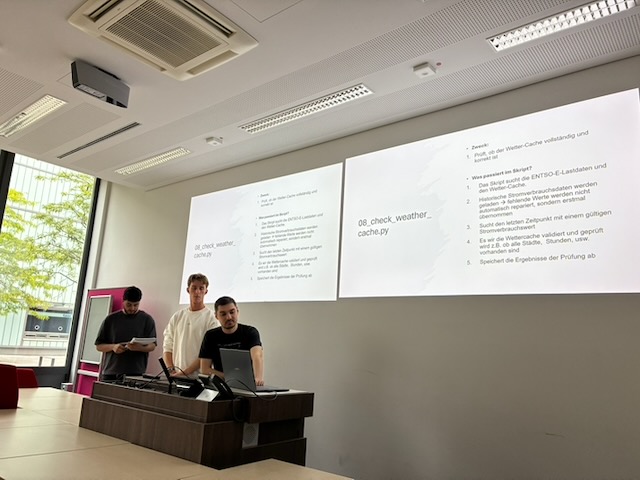
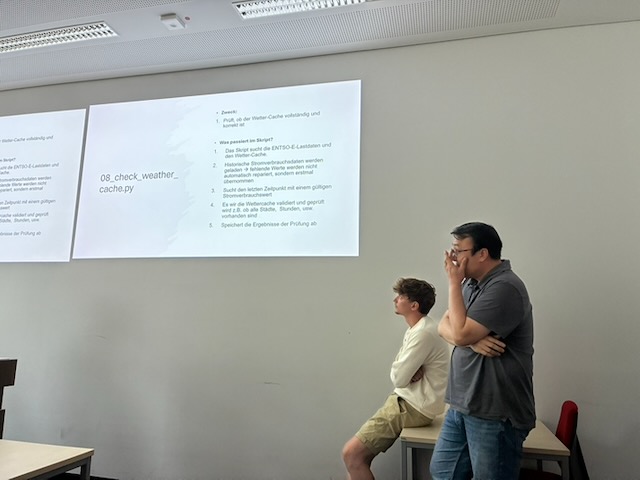
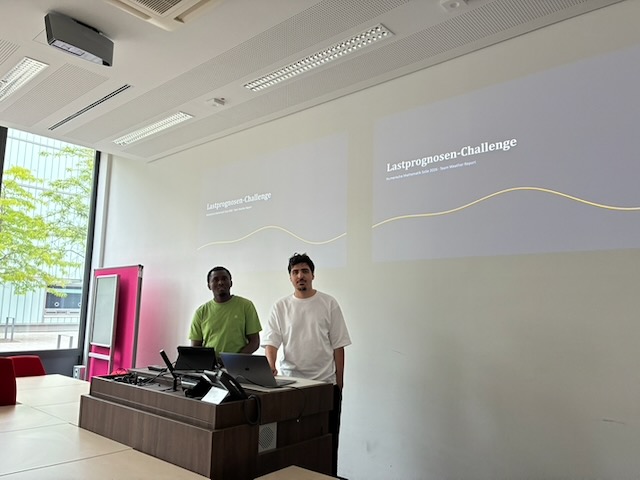
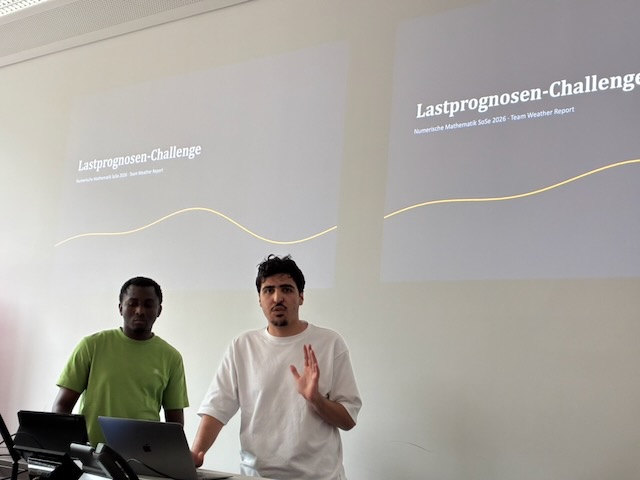
The challenge was based on data from the ENTSO-E Transparency Platform; the challenge infrastructure was provided by the SpotSeven Lab at the Institute for Data Science, Engineering, and Analytics (IDE+A) of TH Köln. Contact: Prof. Dr. Thomas Bartz-Beielstein.